
The question
The speed–time graph shows the motion of a car over 20 seconds. The car starts from rest and speeds up uniformly to 18 m/s in the first 6 seconds. It then moves at a constant 18 m/s until , and then slows down uniformly and stops at .
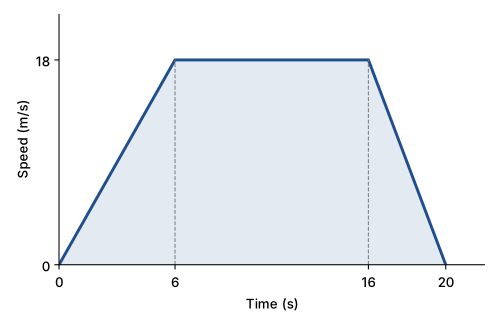
(a) Find the rate of change of speed in the last 4 seconds. [2 marks]
(b) Find the total distance travelled by the car. [3 marks]
(c) Find the average speed of the car for the whole 20 seconds. [2 marks]
Cambridge IGCSE note: finding distance from the area under a speed–time graph is Extended content in 0580.
The common wrong answer
Parts (a) and (b) usually go fine. Part (c) is where marks disappear. Many students write:
The car’s lowest speed is 0 and its highest is 18, so “the average must be halfway”. It isn’t. That shortcut only works if the speed changes at a steady rate for the whole journey. Here the car spends 10 of its 20 seconds cruising at the top speed, so its average speed must be well above 9 m/s.
A second version of the same mistake is to use the rectangle as the distance, which gives 18 m/s. That treats the car as if it were at 18 m/s the whole time, including the moments it was standing still.
The correct working
(a) Rate of change of speed = gradient of the graph from to :
So the rate of change of speed is (a deceleration of ).
(b) Distance = area under the speed–time graph. Split it into three parts:
You can also treat the whole shape as one trapezium, with parallel sides 10 s and 20 s and height 18 m/s:
So the total distance is 270 m.
(c) Average speed always means :
So the average speed is 13.5 m/s.
Why it works
Average speed is defined as . It is not the average of the speeds you can see on the graph. The car’s speed is different at every moment, and the time it spends at each speed matters. Ten seconds at 18 m/s counts for far more than the instant it passes through 0.
The area under a speed–time graph is the distance because, over a short time, , which is a thin strip of height “speed” and width “time”. Adding up all the strips gives the area. Once you have the true distance from the area, dividing by the total time gives the true average.
How to spot it next time
- If you see “average speed”, write the formula first: . Never add speeds and divide by 2.
- On a speed–time graph the distance is the area, and the rate of change of speed is the gradient. Label which one each part of the question needs.
- Sanity check: the average speed must lie between the lowest and highest speeds. If the car spends most of its time near the top speed, the average should be closer to the top speed than to the middle.